


|
| Executive |
Company |
2016 Rank |
2016 total comp. |
2015 Rank |
2015 total comp. |
1-year percent change |
1-year percent stock change |
|
|
Omar Ishrak |
Medtronic plc |
1 |
50,989,783 |
2 |
40,500,470 |
25.9 |
8.5 |
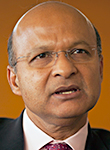 | Title(s): |
Ch, CEO |
 |
2016 Revenue: |
$29,361,000,000 |
| 2016 Base Salary: |
$1,548,216 |
1-year % change: |
2.8% |
| 1-year % change: |
3.0% |
2016 Profit: |
$3,968,000,000 |
| Bonus: |
$6,070,758 |
Stock Symbol: |
MDT |
| Miscellaneous: |
$90,299 |
Headquarters: |
Fridley |
| Stock gains: |
$13,556,856 |
Company
Description: |
Develops medical technology products that treat cardiac and vascular diseases, diabetes, and neurological and musculoskeletal conditions. |
| Shares Vesting: |
$29,723,654 |
|
|
|
Jeffrey Ettinger |
Hormel Foods Corp. |
2 |
35,857,999 |
21 |
5,691,736 |
530.0 |
15.7 |
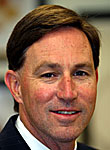 | Title(s): |
Ch |
 |
2016 Revenue: |
$9,510,779,000 |
| 2016 Base Salary: |
$1,019,455 |
1-year % change: |
3.8% |
| 1-year % change: |
1.9% |
2016 Profit: |
$890,138,000 |
| Bonus: |
$5,492,600 |
Stock Symbol: |
HRL |
| Miscellaneous: |
$57,789 |
Headquarters: |
Austin |
| Stock gains: |
$29,288,155 |
Company
Description: |
Produces food products for consumers, retail grocers, food-service and industrial markets |
| Shares Vesting: |
|
|
|
|
Stephen Hemsley |
UnitedHealth Group Inc. |
3 |
31,298,553 |
6 |
20,093,213 |
55.8 |
38.4 |
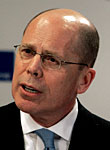 | Title(s): |
CEO |
 |
2016 Revenue: |
$184,840,000,000 |
| 2016 Base Salary: |
$1,300,000 |
1-year % change: |
17.7% |
| 1-year % change: |
-3.7% |
2016 Profit: |
$7,017,000,000 |
| Bonus: |
$4,908,500 |
Stock Symbol: |
UNH |
| Miscellaneous: |
$137,358 |
Headquarters: |
Minnetonka |
| Stock gains: |
$10,776,000 |
Company
Description: |
A diversified health company. UnitedHealth offers products and services through two platforms. UnitedHealthcare provides health care coverage and benefits services; and Optum provides information and technology enabled health services. |
| Shares Vesting: |
$14,176,695 |
|
|
|
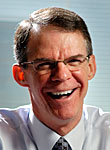
Richard Davis |
U.S. Bancorp |
4 |
29,390,770 |
5 |
21,754,748 |
35.1 |
23.4 |
 | Title(s): |
Ch. and former CEO |
 |
2016 Revenue: |
$21,308,000,000 |
| 2016 Base Salary: |
$1,400,000 |
1-year % change: |
4.9% |
| 1-year % change: |
7.7% |
2016 Profit: |
$5,888,000,000 |
| Bonus: |
$3,046,050 |
Stock Symbol: |
USB |
| Miscellaneous: |
$15,680 |
Headquarters: |
Minneapolis |
| Stock gains: |
$19,085,830 |
Company
Description: |
Regional bank holding company |
| Shares Vesting: |
$5,843,210 |
|
|
|
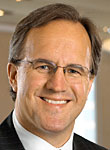
Douglas Baker |
Ecolab Inc. |
5 |
25,315,464 |
3 |
23,772,803 |
6.5 |
3.8 |
 | Title(s): |
Ch, CEO |
 |
2016 Revenue: |
$13,152,800,000 |
| 2016 Base Salary: |
$1,187,500 |
1-year % change: |
-2.9% |
| 1-year % change: |
4.1% |
2016 Profit: |
$1,229,600,000 |
| Bonus: |
$1,699,100 |
Stock Symbol: |
ECL |
| Miscellaneous: |
$193,386 |
Headquarters: |
St. Paul |
| Stock gains: |
$18,350,338 |
Company
Description: |
Provides water, hygiene and energy technologies and services to food, hospitality, healthcare, industrial and oil and gas markets. |
| Shares Vesting: |
$3,885,140 |
|
|
|
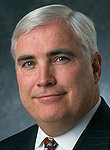
Randall Hogan |
Pentair plc |
6 |
23,189,843 |
16 |
10,697,791 |
116.8 |
14.0 |
 | Title(s): |
Ch, CEO |
 |
2016 Revenue: |
$4,890,000,000 |
| 2016 Base Salary: |
$1,275,795 |
1-year % change: |
5.9% |
| 1-year % change: |
0.0% |
2016 Profit: |
$451,600,000 |
| Bonus: |
$2,877,513 |
Stock Symbol: |
PNR |
| Miscellaneous: |
$176,636 |
Headquarters: |
Golden Valley |
| Stock gains: |
$10,049,715 |
Company
Description: |
Is a diversified industrial manufacturing company serving the global water and electrical segments. |
| Shares Vesting: |
$8,810,184 |
|
|
|
Michael Hoffman |
The Toro Co. |
7 |
21,530,276 |
15 |
11,070,525 |
94.5 |
29.1 |
 | Title(s): |
Ch, |
 |
2016 Revenue: |
$2,421,616,000 |
| 2016 Base Salary: |
$990,000 |
1-year % change: |
0.8% |
| 1-year % change: |
3.1% |
2016 Profit: |
$236,723,000 |
| Bonus: |
$1,023,536 |
Stock Symbol: |
TTC |
| Miscellaneous: |
$205,002 |
Headquarters: |
Bloomington |
| Stock gains: |
$16,204,312 |
Company
Description: |
Makes professional turf maintenance equipment and services, turf irrigation systems, landscaping equipment and lighting, professional snow and ice management products, rental and specialty construction equipment, and residential products |
| Shares Vesting: |
$3,107,426 |
|
|
|
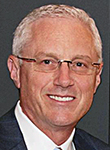
Gary Hendrickson |
Valspar Corp. |
8 |
20,168,485 |
13 |
11,298,236 |
78.5 |
24.8 |
 | Title(s): |
Ch, P, CEO |
 |
2016 Revenue: |
$4,212,448,000 |
| 2016 Base Salary: |
$1,041,647 |
1-year % change: |
-1.2% |
| 1-year % change: |
3.0% |
2016 Profit: |
$341,356,000 |
| Bonus: |
$2,213,479 |
Stock Symbol: |
VAL |
| Miscellaneous: |
$381,780 |
Headquarters: |
Minneapolis |
| Stock gains: |
$3,098,765 |
Company
Description: |
Makes paint and coatings |
| Shares Vesting: |
$13,432,814 |
|
|
|
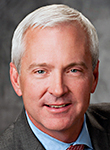
Benjamin Fowke |
Xcel Energy Inc. |
9 |
18,500,718 |
14 |
11,169,431 |
65.6 |
17.1 |
 | Title(s): |
Ch., P, CEO |
 |
2016 Revenue: |
$11,106,920,000 |
| 2016 Base Salary: |
$1,200,000 |
1-year % change: |
0.7% |
| 1-year % change: |
0.0% |
2016 Profit: |
$1,123,379,000 |
| Bonus: |
$1,828,800 |
Stock Symbol: |
XEL |
| Miscellaneous: |
$52,902 |
Headquarters: |
Minneapolis |
| Stock gains: |
|
Company
Description: |
Electric and natural gas utility |
| Shares Vesting: |
$15,419,016 |
|
|
|
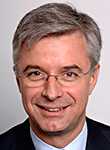
Hubert Joly |
Best Buy Co. Inc. |
10 |
16,807,608 |
4 |
23,256,551 |
-27.7 |
67.7 |
 | Title(s): |
Ch, CEO |
 |
2016 Revenue: |
$39,403,000,000 |
| 2016 Base Salary: |
$1,175,000 |
1-year % change: |
-0.3% |
| 1-year % change: |
0.0% |
2016 Profit: |
$1,207,000,000 |
| Bonus: |
$2,878,750 |
Stock Symbol: |
BBY |
| Miscellaneous: |
$494,275 |
Headquarters: |
Richfield |
| Stock gains: |
|
Company
Description: |
A multi-national, multi-channel retailer of technology products and services. |
| Shares Vesting: |
$12,259,583 |
|
|
|
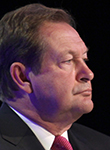
Inge Thulin |
3M Co. |
11 |
16,760,615 |
8 |
15,620,581 |
7.3 |
21.7 |
 | Title(s): |
Ch, P, CEO |
 |
2016 Revenue: |
$30,109,000,000 |
| 2016 Base Salary: |
$1,483,929 |
1-year % change: |
-0.5% |
| 1-year % change: |
2.5% |
2016 Profit: |
$5,050,000,000 |
| Bonus: |
$2,303,678 |
Stock Symbol: |
MMM |
| Miscellaneous: |
$560,110 |
Headquarters: |
Maplewood |
| Stock gains: |
$3,901,684 |
Company
Description: |
Global diversified technology company with products for health care; industrial; consumer and office; display and graphics; electronics and telecommunications; safety, security and protection; transportation and other markets |
| Shares Vesting: |
$8,511,214 |
|
|
|
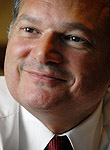
James Cracchiolo |
Ameriprise Financial Inc. |
12 |
15,083,018 |
1 |
41,829,330 |
-63.9 |
7.7 |
 | Title(s): |
Ch, CEO |
 |
2016 Revenue: |
$11,535,000,000 |
| 2016 Base Salary: |
$1,025,000 |
1-year % change: |
-1.7% |
| 1-year % change: |
0.0% |
2016 Profit: |
$1,427,000,000 |
| Bonus: |
$6,258,000 |
Stock Symbol: |
AMP |
| Miscellaneous: |
$608,761 |
Headquarters: |
Minneapolis |
| Stock gains: |
|
Company
Description: |
Diversified financial services company providing comprehensive financial planning needs of the mass affluent and affluent |
| Shares Vesting: |
$7,191,257 |
|
|
|
Kendall Powell |
General Mills Inc. |
13 |
14,302,884 |
9 |
14,815,089 |
-3.5 |
15.3 |
 | Title(s): |
Ch., CEO |
 |
2016 Revenue: |
$15,950,300,000 |
| 2016 Base Salary: |
$1,206,500 |
1-year % change: |
-7.7% |
| 1-year % change: |
0.5% |
2016 Profit: |
$1,632,100,000 |
| Bonus: |
$2,258,568 |
Stock Symbol: |
GIS |
| Miscellaneous: |
$187,903 |
Headquarters: |
Golden Valley |
| Stock gains: |
$5,540,625 |
Company
Description: |
Marketer of consumer foods |
| Shares Vesting: |
$5,109,288 |
|
|
|
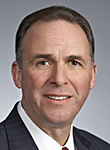
Joseph Puishys |
Apogee Enterprises Inc. |
14 |
9,221,760 |
10 |
14,199,310 |
-35.1 |
47.4 |
 | Title(s): |
P, CEO |
 |
2016 Revenue: |
$1,062,556,000 |
| 2016 Base Salary: |
$901,058 |
1-year % change: |
10.0% |
| 1-year % change: |
7.9% |
2016 Profit: |
$82,607,000 |
| Bonus: |
$2,045,000 |
Stock Symbol: |
APOG |
| Miscellaneous: |
$52,739 |
Headquarters: |
Edina |
| Stock gains: |
$3,788,125 |
Company
Description: |
Fabricates, distributes and installs glass products and systems |
| Shares Vesting: |
$2,434,838 |
|
|
|
Brian Cornell |
Target Corp. |
15 |
9,084,240 |
18 |
8,980,274 |
1.2 |
-8.1 |
 | Title(s): |
Ch, CEO |
 |
2016 Revenue: |
$69,495,000,000 |
| 2016 Base Salary: |
$1,300,000 |
1-year % change: |
-5.8% |
| 1-year % change: |
0.0% |
2016 Profit: |
$2,669,000,000 |
| Bonus: |
|
Stock Symbol: |
TGT |
| Miscellaneous: |
$330,532 |
Headquarters: |
Minneapolis |
| Stock gains: |
|
Company
Description: |
General merchandise retailer |
| Shares Vesting: |
$7,453,708 |
|
|
|
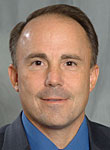
Patrick McHale |
Graco Inc. |
16 |
7,977,846 |
28 |
4,247,052 |
87.8 |
17.4 |
 | Title(s): |
P, CEO |
 |
2016 Revenue: |
$1,329,293,000 |
| 2016 Base Salary: |
$772,900 |
1-year % change: |
3.3% |
| 1-year % change: |
3.0% |
2016 Profit: |
$40,674,000 |
| Bonus: |
$466,021 |
Stock Symbol: |
GGG |
| Miscellaneous: |
$13,961 |
Headquarters: |
Minneapolis |
| Stock gains: |
$6,724,964 |
Company
Description: |
Makes products to move, measure, control, dispense and spray fluid materials |
| Shares Vesting: |
|
|
|
|
Lee Schram |
Deluxe Corp. |
17 |
7,445,143 |
30 |
3,444,384 |
116.2 |
33.8 |
 | Title(s): |
CEO |
 |
2016 Revenue: |
$1,849,062,000 |
| 2016 Base Salary: |
$925,833 |
1-year % change: |
4.3% |
| 1-year % change: |
2.8% |
2016 Profit: |
$229,382,000 |
| Bonus: |
$1,083,745 |
Stock Symbol: |
DLX |
| Miscellaneous: |
$21,287 |
Headquarters: |
Shoreview |
| Stock gains: |
$5,414,278 |
Company
Description: |
Sells checks, forms and marketing and other services to financial institutions, small businesses and consumers. |
| Shares Vesting: |
|
|
|
|
Douglas Milroy |
G&K Services Inc. |
18 |
7,246,511 |
12 |
11,636,199 |
-37.7 |
|
 | Title(s): |
Ch, CEO |
 |
2016 Revenue: |
$982,975,000 |
| 2016 Base Salary: |
$762,615 |
1-year % change: |
3.4% |
| 1-year % change: |
8.2% |
2016 Profit: |
$56,994,000 |
| Bonus: |
$629,066 |
Stock Symbol: |
GKSR |
| Miscellaneous: |
$206,139 |
Headquarters: |
Minnetonka |
| Stock gains: |
$883,635 |
Company
Description: |
Provider of branded uniforms and facility services. |
| Shares Vesting: |
$4,765,056 |
|
|
|
Andrew Duff |
Piper Jaffray Companies |
19 |
6,081,980 |
22 |
5,574,868 |
9.1 |
79.5 |
 | Title(s): |
Ch, CEO |
 |
2016 Revenue: |
$769,874,000 |
| 2016 Base Salary: |
$650,000 |
1-year % change: |
10.6% |
| 1-year % change: |
0.0% |
2016 Profit: |
$-21,952,000 |
| Bonus: |
$2,736,475 |
Stock Symbol: |
PJC |
| Miscellaneous: |
$66,783 |
Headquarters: |
Minneapolis |
| Stock gains: |
$782,906 |
Company
Description: |
General securities brokerage, corporate and public finance |
| Shares Vesting: |
$1,845,816 |
|
|
|
James Owens |
H.B. Fuller Co. |
20 |
5,879,823 |
36 |
2,857,616 |
105.8 |
19.6 |
 | Title(s): |
P, CEO |
 |
2016 Revenue: |
$2,094,605,000 |
| 2016 Base Salary: |
$1,031,760 |
1-year % change: |
0.5% |
| 1-year % change: |
4.7% |
2016 Profit: |
$124,128,000 |
| Bonus: |
$474,511 |
Stock Symbol: |
FUL |
| Miscellaneous: |
$324,922 |
Headquarters: |
Vadnais Heights |
| Stock gains: |
$1,740,930 |
Company
Description: |
A global adhesives provider serving customers in the packaging, hygiene, electronics and assembly materials, paper converting, woodworking, construction, automotive and consumer businesses. |
| Shares Vesting: |
$2,307,700 |
|
|
|
Scott Wine |
Polaris Industries Inc. |
21 |
5,603,493 |
7 |
18,972,508 |
-70.5 |
-1.7 |
 | Title(s): |
Ch, CEO |
 |
2016 Revenue: |
$4,516,629,000 |
| 2016 Base Salary: |
$985,000 |
1-year % change: |
-4.3% |
| 1-year % change: |
0.3% |
2016 Profit: |
$212,948,000 |
| Bonus: |
|
Stock Symbol: |
PII |
| Miscellaneous: |
$76,544 |
Headquarters: |
Medina |
| Stock gains: |
$3,449,500 |
Company
Description: |
Makes off-road vehicles including all-terrain vehicles and side-by-side vehicles; snowmobiles, motorcycles, small-electric vehicles and accessories. |
| Shares Vesting: |
$1,092,449 |
|
|
|
James "Joc" O'Rourke |
Mosaic Co. |
22 |
5,017,961 |
NR |
3,594,371 |
39.6 |
10.7 |
 | Title(s): |
P, CEO |
 |
2016 Revenue: |
$7,162,800,000 |
| 2016 Base Salary: |
$1,100,000 |
1-year % change: |
-19.5% |
| 1-year % change: |
23.1% |
2016 Profit: |
$297,800,000 |
| Bonus: |
$1,320,000 |
Stock Symbol: |
MOS |
| Miscellaneous: |
$396,223 |
Headquarters: |
Plymouth |
| Stock gains: |
|
Company
Description: |
Produces and distributes concentrated phosphate and potash, crop nutrition products and feed ingredients. |
| Shares Vesting: |
$2,201,738 |
|
|
|
Arthur Przybyl |
ANI Pharmaceuticals Inc. |
23 |
4,750,811 |
41 |
1,809,651 |
162.5 |
34.3 |
 | Title(s): |
P, CEO |
 |
2016 Revenue: |
$128,622,000 |
| 2016 Base Salary: |
$572,000 |
1-year % change: |
68.5% |
| 1-year % change: |
0.6% |
2016 Profit: |
$3,934,000 |
| Bonus: |
$400,400 |
Stock Symbol: |
ANIP |
| Miscellaneous: |
$29,100 |
Headquarters: |
Baudette |
| Stock gains: |
$3,428,595 |
Company
Description: |
Makes prescription pharmaceuticals. ANI also performs contract manufacturing for other pharmaceutical companies. |
| Shares Vesting: |
$320,716 |
|
|
|
Kevin Gilligan |
Capella Education Co. |
24 |
4,732,424 |
37 |
2,716,017 |
74.2 |
95.0 |
 | Title(s): |
Ch, CEO |
 |
2016 Revenue: |
$429,390,000 |
| 2016 Base Salary: |
$787,653 |
1-year % change: |
-0.2% |
| 1-year % change: |
2.2% |
2016 Profit: |
$42,404,000 |
| Bonus: |
$1,821,933 |
Stock Symbol: |
CPLA |
| Miscellaneous: |
$14,245 |
Headquarters: |
Minneapolis |
| Stock gains: |
$1,352,366 |
Company
Description: |
Provides online education, primarily through Capella University, an online university. Capella also owns Sophia, technology to support self-paced learning and Capella Learning Solutions, a provider of online non-degree, high skills training. |
| Shares Vesting: |
$756,227 |
|
|
|
T. Michael Miller |
OneBeacon Insurance Group |
25 |
4,718,405 |
25 |
4,844,846 |
-2.6 |
37.3 |
 | Title(s): |
P, CEO |
 |
2016 Revenue: |
$1,194,400,000 |
| 2016 Base Salary: |
$500,000 |
1-year % change: |
0.7% |
| 1-year % change: |
0.0% |
2016 Profit: |
$107,400,000 |
| Bonus: |
$1,868,000 |
Stock Symbol: |
OB |
| Miscellaneous: |
$269,830 |
Headquarters: |
Minnetonka |
| Stock gains: |
|
Company
Description: |
Offers a range of specialty insurance products and services sold through independent
agents, brokers, wholesalers and managing general agencies. |
| Shares Vesting: |
$2,080,575 |
|
|
|
Archie Black |
SPS Commerce Inc. |
26 |
4,190,551 |
27 |
4,665,251 |
-10.2 |
-0.5 |
 | Title(s): |
P, CEO |
 |
2016 Revenue: |
$193,295,000 |
| 2016 Base Salary: |
$495,000 |
1-year % change: |
21.9% |
| 1-year % change: |
16.5% |
2016 Profit: |
$5,710,000 |
| Bonus: |
$102,350 |
Stock Symbol: |
SPSC |
| Miscellaneous: |
$3,975 |
Headquarters: |
Minneapolis |
| Stock gains: |
$2,931,111 |
Company
Description: |
Provides cloud-based digital retail solutions |
| Shares Vesting: |
$658,115 |
|
|
|
Scott Anderson |
Patterson Cos. Inc. |
27 |
4,090,178 |
39 |
2,258,990 |
81.1 |
-5.8 |
 | Title(s): |
Ch, P, CEO |
 |
2016 Revenue: |
$5,601,865,000 |
| 2016 Base Salary: |
$770,477 |
1-year % change: |
12.8% |
| 1-year % change: |
24.4% |
2016 Profit: |
$178,051,000 |
| Bonus: |
$826,160 |
Stock Symbol: |
PDCO |
| Miscellaneous: |
$46,872 |
Headquarters: |
Mendota Heights |
| Stock gains: |
|
Company
Description: |
Distributes supplies and equipment to dental and animal health markets. |
| Shares Vesting: |
$2,446,669 |
|
|
|
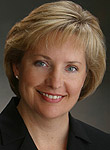
Sally Smith |
Buffalo Wild Wings Inc. |
28 |
3,393,662 |
17 |
10,416,256 |
-67.4 |
-3.3 |
 | Title(s): |
P, CEO |
 |
2016 Revenue: |
$1,986,793,000 |
| 2016 Base Salary: |
$875,000 |
1-year % change: |
9.6% |
| 1-year % change: |
4.0% |
2016 Profit: |
$94,745,000 |
| Bonus: |
$374,605 |
Stock Symbol: |
BWLD |
| Miscellaneous: |
$183,064 |
Headquarters: |
St. Louis Park |
| Stock gains: |
$230,952 |
Company
Description: |
A restaurant chain featuring a fast-casual grill and sports bar concept |
| Shares Vesting: |
$1,730,041 |
|
|
|
Gary Maharaj |
Surmodics Inc. |
29 |
3,216,430 |
54 |
835,492 |
285.0 |
37.8 |
 | Title(s): |
P, CEO |
 |
2016 Revenue: |
$72,586,000 |
| 2016 Base Salary: |
$481,000 |
1-year % change: |
13.0% |
| 1-year % change: |
5.3% |
2016 Profit: |
$9,772,000 |
| Bonus: |
$432,900 |
Stock Symbol: |
SRDX |
| Miscellaneous: |
$4,879 |
Headquarters: |
Eden Prairie |
| Stock gains: |
$2,297,651 |
Company
Description: |
Makes surface modification and in vitro diagnostic technologies for the health care industry |
| Shares Vesting: |
|
|
|
|
Charles Kummeth |
Bio-Techne Corp. |
30 |
2,780,459 |
33 |
3,111,132 |
-10.6 |
16.1 |
 | Title(s): |
P, CEO |
 |
2016 Revenue: |
$528,123,000 |
| 2016 Base Salary: |
$800,000 |
1-year % change: |
13.5% |
| 1-year % change: |
28.0% |
2016 Profit: |
$78,511,000 |
| Bonus: |
$1,221,097 |
Stock Symbol: |
TECH |
| Miscellaneous: |
$38,241 |
Headquarters: |
Minneapolis |
| Stock gains: |
|
Company
Description: |
Fka Techne, makes hematology controls and biotechnology products for research scientists. |
| Shares Vesting: |
$721,121 |
|
|
|
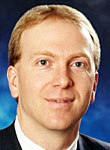
John Wiehoff |
C.H. Robinson Worldwide Inc. |
31 |
2,672,076 |
23 |
5,534,194 |
-51.7 |
21.0 |
 | Title(s): |
Ch, P, CEO |
 |
2016 Revenue: |
$13,144,413,000 |
| 2016 Base Salary: |
$1,167,000 |
1-year % change: |
-2.5% |
| 1-year % change: |
184.6% |
2016 Profit: |
$513,384,000 |
| Bonus: |
$936,604 |
Stock Symbol: |
CHRW |
| Miscellaneous: |
$23,344 |
Headquarters: |
Eden Prairie |
| Stock gains: |
|
Company
Description: |
Provides transportation services and logistics support |
| Shares Vesting: |
$545,128 |
|
|
|
Daniel Hanrahan |
Regis Corp. |
32 |
2,556,484 |
34 |
2,962,070 |
-13.7 |
12.5 |
 | Title(s): |
former P, CEO |
 |
2016 Revenue: |
$1,745,357,000 |
| 2016 Base Salary: |
$882,000 |
1-year % change: |
-4.0% |
| 1-year % change: |
0.0% |
2016 Profit: |
$4,540,000 |
| Bonus: |
$1,315,694 |
Stock Symbol: |
RGS |
| Miscellaneous: |
$38,280 |
Headquarters: |
Edina |
| Stock gains: |
|
Company
Description: |
Owns, operates and franchises hair salons in mall and strip-center locations |
| Shares Vesting: |
$320,510 |
|
|
|
H. Chris Killingstad |
Tennant Co. |
33 |
2,546,846 |
35 |
2,922,062 |
-12.8 |
28.3 |
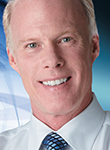 | Title(s): |
P, CEO |
 |
2016 Revenue: |
$808,572,000 |
| 2016 Base Salary: |
$710,517 |
1-year % change: |
-0.4% |
| 1-year % change: |
0.7% |
2016 Profit: |
$46,614,000 |
| Bonus: |
$783,359 |
Stock Symbol: |
TNC |
| Miscellaneous: |
$116,782 |
Headquarters: |
Golden Valley |
| Stock gains: |
|
Company
Description: |
Makes mechanized cleaning equipment, sustainable cleaning technologies, aftermarket parts and consumables, specialty surface coatings, provides equipment maintenance and repair services and offers financing, rental and leasing programs. |
| Shares Vesting: |
$936,188 |
|
|
|
Craig Dahl |
TCF Financial Corp. |
34 |
2,263,288 |
NR |
1,416,682 |
59.8 |
41.9 |
 | Title(s): |
vice chairman, CEO |
 |
2016 Revenue: |
$1,314,006,000 |
| 2016 Base Salary: |
$846,923 |
1-year % change: |
4.1% |
| 1-year % change: |
30.5% |
2016 Profit: |
$212,124,000 |
| Bonus: |
$918,356 |
Stock Symbol: |
TCB |
| Miscellaneous: |
$93,564 |
Headquarters: |
Wayzata |
| Stock gains: |
|
Company
Description: |
National financial bank holding company with branches in Minnesota, Illinois, Michigan, Colorado, Wisconsin, Indiana, Arizona and South Dakota providing retail and commercial banking services. TCF, through subsidiaries, also conducts commercial lending. |
| Shares Vesting: |
$404,445 |
|
|
|
Brett Heffes |
Winmark Corp. |
35 |
2,241,877 |
61 |
609,180 |
268.0 |
36.2 |
 | Title(s): |
CEO |
 |
2016 Revenue: |
$66,580,300 |
| 2016 Base Salary: |
$306,000 |
1-year % change: |
-4.1% |
| 1-year % change: |
2.0% |
2016 Profit: |
$22,217,600 |
| Bonus: |
$300,000 |
Stock Symbol: |
WINA |
| Miscellaneous: |
$9,180 |
Headquarters: |
Golden Valley |
| Stock gains: |
$1,626,697 |
Company
Description: |
Franchises five retail brands that buy, sell, trade and consign used and new merchandise and offers equipment leasing products |
| Shares Vesting: |
|
|
|
|
LuAnn Via |
Christopher & Banks Corp. |
36 |
2,026,564 |
53 |
866,577 |
133.9 |
-24.3 |
 | Title(s): |
former P, CEO |
 |
2016 Revenue: |
$381,605,000 |
| 2016 Base Salary: |
$827,782 |
1-year % change: |
-0.6% |
| 1-year % change: |
-2.6% |
2016 Profit: |
$-17,783,000 |
| Bonus: |
$285,600 |
Stock Symbol: |
CBK |
| Miscellaneous: |
$913,182 |
Headquarters: |
Plymouth |
| Stock gains: |
|
Company
Description: |
Retailer of women's clothing |
| Shares Vesting: |
|
|
|
|
Ron Konezny |
Digi International Inc. |
37 |
1,774,863 |
56 |
796,818 |
122.7 |
-3.3 |
 | Title(s): |
P, CEO |
 |
2016 Revenue: |
$197,921,000 |
| 2016 Base Salary: |
$465,000 |
1-year % change: |
-4.3% |
| 1-year % change: |
32.3% |
2016 Profit: |
$12,704,000 |
| Bonus: |
$776,550 |
Stock Symbol: |
DGII |
| Miscellaneous: |
$11,375 |
Headquarters: |
Minnetonka |
| Stock gains: |
|
Company
Description: |
Makes data communications hardware and software products |
| Shares Vesting: |
$521,938 |
|
|
|
Thomas Stoelk |
Northern Oil and Gas Inc. |
38 |
1,695,508 |
NR |
|
|
-28.8 |
 | Title(s): |
interim CEO, CFO |
 |
2016 Revenue: |
$144,903,496 |
| 2016 Base Salary: |
$508,333 |
1-year % change: |
-47.3% |
| 1-year % change: |
% |
2016 Profit: |
$-293,493,708 |
| Bonus: |
$758,333 |
Stock Symbol: |
NOG |
| Miscellaneous: |
$62,099 |
Headquarters: |
Wayzata |
| Stock gains: |
|
Company
Description: |
An independent non-operator energy company engaged in the exploration and development of oil and natural gas properties in North Dakota and Montana. |
| Shares Vesting: |
$366,743 |
|
|
|
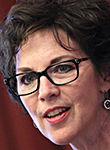
Shelly Ibach |
Select Comfort Corp. |
39 |
1,572,727 |
42 |
1,753,933 |
-10.3 |
5.7 |
 | Title(s): |
P, CEO |
 |
2016 Revenue: |
$1,311,291,000 |
| 2016 Base Salary: |
$814,615 |
1-year % change: |
8.0% |
| 1-year % change: |
4.5% |
2016 Profit: |
$51,417,000 |
| Bonus: |
$354,998 |
Stock Symbol: |
SCSS |
| Miscellaneous: |
$23,205 |
Headquarters: |
Plymouth |
| Stock gains: |
$156,616 |
Company
Description: |
Makes and sells Sleep Number beds and bedding. The Sleep Number mattress allows individuals to adjust the firmness and support on each side of the bed. |
| Shares Vesting: |
$223,293 |
|
|
|
Jeffrey Graves |
MTS Systems Corp. |
40 |
1,555,779 |
47 |
1,436,462 |
8.3 |
-21.6 |
 | Title(s): |
P, CEO |
 |
2016 Revenue: |
$708,925,000 |
| 2016 Base Salary: |
$647,500 |
1-year % change: |
26.2% |
| 1-year % change: |
1.6% |
2016 Profit: |
$17,425,000 |
| Bonus: |
$647,500 |
Stock Symbol: |
MTSC |
| Miscellaneous: |
$20,667 |
Headquarters: |
Eden Prairie |
| Stock gains: |
|
Company
Description: |
Makes test and simulation systems and related services, as well as industrial position sensors |
| Shares Vesting: |
$240,112 |
|
|
|
Cheryl Beranek |
Clearfield Inc. |
41 |
1,438,122 |
51 |
904,999 |
58.9 |
40.0 |
 | Title(s): |
P, CEO |
 |
2016 Revenue: |
$77,864,000 |
| 2016 Base Salary: |
$306,024 |
1-year % change: |
25.5% |
| 1-year % change: |
8.4% |
2016 Profit: |
$7,403,000 |
| Bonus: |
$437,381 |
Stock Symbol: |
CLFD |
| Miscellaneous: |
$13,849 |
Headquarters: |
Plymouth |
| Stock gains: |
$297,900 |
Company
Description: |
Designer and manufacturer of fiber management products that enable broadband connectivity. |
| Shares Vesting: |
$382,968 |
|
|
|
Alan Hodnik |
Allete Inc. |
42 |
1,425,288 |
45 |
1,465,142 |
-2.7 |
30.9 |
 | Title(s): |
Ch, P, CEO |
 |
2016 Revenue: |
$1,339,700,000 |
| 2016 Base Salary: |
$613,584 |
1-year % change: |
-9.9% |
| 1-year % change: |
4.8% |
2016 Profit: |
$155,800,000 |
| Bonus: |
$436,029 |
Stock Symbol: |
ALE |
| Miscellaneous: |
$127,303 |
Headquarters: |
Duluth |
| Stock gains: |
|
Company
Description: |
Is an energy company in the Upper Midwest |
| Shares Vesting: |
$248,372 |
|
|
|
Christopher Metz |
Arctic Cat Inc. |
43 |
1,349,440 |
NR |
|
|
|
 | Title(s): |
P, CEO |
 |
2016 Revenue: |
$508,222,000 |
| 2016 Base Salary: |
$695,192 |
1-year % change: |
-16.7% |
| 1-year % change: |
% |
2016 Profit: |
$-77,451,000 |
| Bonus: |
|
Stock Symbol: |
ACAT |
| Miscellaneous: |
$167,496 |
Headquarters: |
Thief River Falls |
| Stock gains: |
|
Company
Description: |
Makes snowmobiles, all-terrain vehicles and related parts, garments and accessories |
| Shares Vesting: |
$486,752 |
|
|
|
Patrick Hawkins |
Hawkins Inc. |
44 |
1,321,436 |
49 |
1,004,282 |
31.6 |
-2.9 |
 | Title(s): |
P, CEO |
 |
2016 Revenue: |
$494,488,000 |
| 2016 Base Salary: |
$386,885 |
1-year % change: |
30.9% |
| 1-year % change: |
4.6% |
2016 Profit: |
$23,204,000 |
| Bonus: |
$279,084 |
Stock Symbol: |
HWKN |
| Miscellaneous: |
$52,281 |
Headquarters: |
Minneapolis |
| Stock gains: |
|
Company
Description: |
Manufacturer and distributor of bulk industrial chemicals |
| Shares Vesting: |
$603,186 |
|
|
|
Tod Carpenter |
Donaldson Co. Inc. |
45 |
1,295,818 |
NR |
970,885 |
33.5 |
9.9 |
 | Title(s): |
P, CEO |
 |
2016 Revenue: |
$2,268,700,000 |
| 2016 Base Salary: |
$742,116 |
1-year % change: |
1.6% |
| 1-year % change: |
27.8% |
2016 Profit: |
$218,800,000 |
| Bonus: |
$106,330 |
Stock Symbol: |
DCI |
| Miscellaneous: |
$147,271 |
Headquarters: |
Bloomington |
| Stock gains: |
$257,140 |
Company
Description: |
Makes filtration systems and replacement parts |
| Shares Vesting: |
$42,961 |
|
|
|
Mark Gross |
Supervalu Inc. |
46 |
1,211,238 |
NR |
425,622 |
184.6 |
-23.3 |
 | Title(s): |
P, CEO |
 |
2016 Revenue: |
$13,519,000,000 |
| 2016 Base Salary: |
$1,000,000 |
1-year % change: |
-6.1% |
| 1-year % change: |
1525.0% |
2016 Profit: |
$109,000,000 |
| Bonus: |
$191,072 |
Stock Symbol: |
SVU |
| Miscellaneous: |
$20,166 |
Headquarters: |
Eden Prairie |
| Stock gains: |
|
Company
Description: |
Grocery wholesaler and retailer, parent company of Cub Foods |
| Shares Vesting: |
|
|
|
|
Charles MacFarlane |
Otter Tail Corp. |
47 |
1,118,709 |
44 |
1,475,754 |
-24.2 |
59.5 |
 | Title(s): |
P, CEO |
 |
2016 Revenue: |
$803,539,000 |
| 2016 Base Salary: |
$575,000 |
1-year % change: |
3.0% |
| 1-year % change: |
11.0% |
2016 Profit: |
$62,037,000 |
| Bonus: |
$395,710 |
Stock Symbol: |
OTTR |
| Miscellaneous: |
$7,375 |
Headquarters: |
Fergus Falls |
| Stock gains: |
|
Company
Description: |
Diversified corporation with investments in electric utility operations, manufacturing,
and plastics. |
| Shares Vesting: |
$140,624 |
|
|
|
Victoria Holt |
Proto Labs Inc. |
48 |
1,093,415 |
48 |
1,263,556 |
-13.5 |
-19.4 |
 | Title(s): |
P, CEO |
 |
2016 Revenue: |
$298,055,000 |
| 2016 Base Salary: |
$529,916 |
1-year % change: |
12.9% |
| 1-year % change: |
3.0% |
2016 Profit: |
$42,707,000 |
| Bonus: |
$302,754 |
Stock Symbol: |
PRLB |
| Miscellaneous: |
$10,600 |
Headquarters: |
Maple Plain |
| Stock gains: |
|
Company
Description: |
Online and technology-enabled quick-turn manufacturer of custom parts for prototyping and short-run production |
| Shares Vesting: |
$250,145 |
|
|
|
Chris Homeister |
Tile Shop Holdings Inc. |
49 |
1,055,000 |
57 |
716,625 |
47.2 |
19.2 |
 | Title(s): |
CEO |
 |
2016 Revenue: |
$324,157,000 |
| 2016 Base Salary: |
$456,250 |
1-year % change: |
10.6% |
| 1-year % change: |
14.1% |
2016 Profit: |
$18,463,000 |
| Bonus: |
$391,875 |
Stock Symbol: |
TTS |
| Miscellaneous: |
|
Headquarters: |
Plymouth |
| Stock gains: |
|
Company
Description: |
A specialty retailer of manufactured and natural stone tiles. |
| Shares Vesting: |
$206,875 |
|
|
|
Jon Sabes |
GWG Holdings Inc. |
50 |
878,153 |
62 |
606,305 |
44.8 |
23.3 |
 | Title(s): |
CEO |
 |
2016 Revenue: |
$69,477,334 |
| 2016 Base Salary: |
$491,546 |
1-year % change: |
75.3% |
| 1-year % change: |
2.4% |
2016 Profit: |
$-3,145,378 |
| Bonus: |
$386,607 |
Stock Symbol: |
GWGH |
| Miscellaneous: |
|
Headquarters: |
Minneapolis |
| Stock gains: |
|
Company
Description: |
Purchases and sells life insurance policies in the secondary market |
| Shares Vesting: |
|
|
The Star Tribune examined annual proxy statements and 10-K filings for the largest publicly held companies in Minnesota. All data are for the most recently completed fiscal year, which in most cases was the 2016 calendar year. Some executives were not included if their pay information was not available at press time. Executives are ranked based on total compensation. The Star Tribune counts salary, bonus, other compensation, the value of restricted stock that vested during the year and the value of options that were exercised during the year. Information was taken from proxy statements filed before June 1, 2017.


